API monitoring best practices: what a 200 response doesn't tell you
What a 200 response hides, and the monitoring practices that catch functional failures, regional outages, expired certificates, and scheduled jobs that never ran.
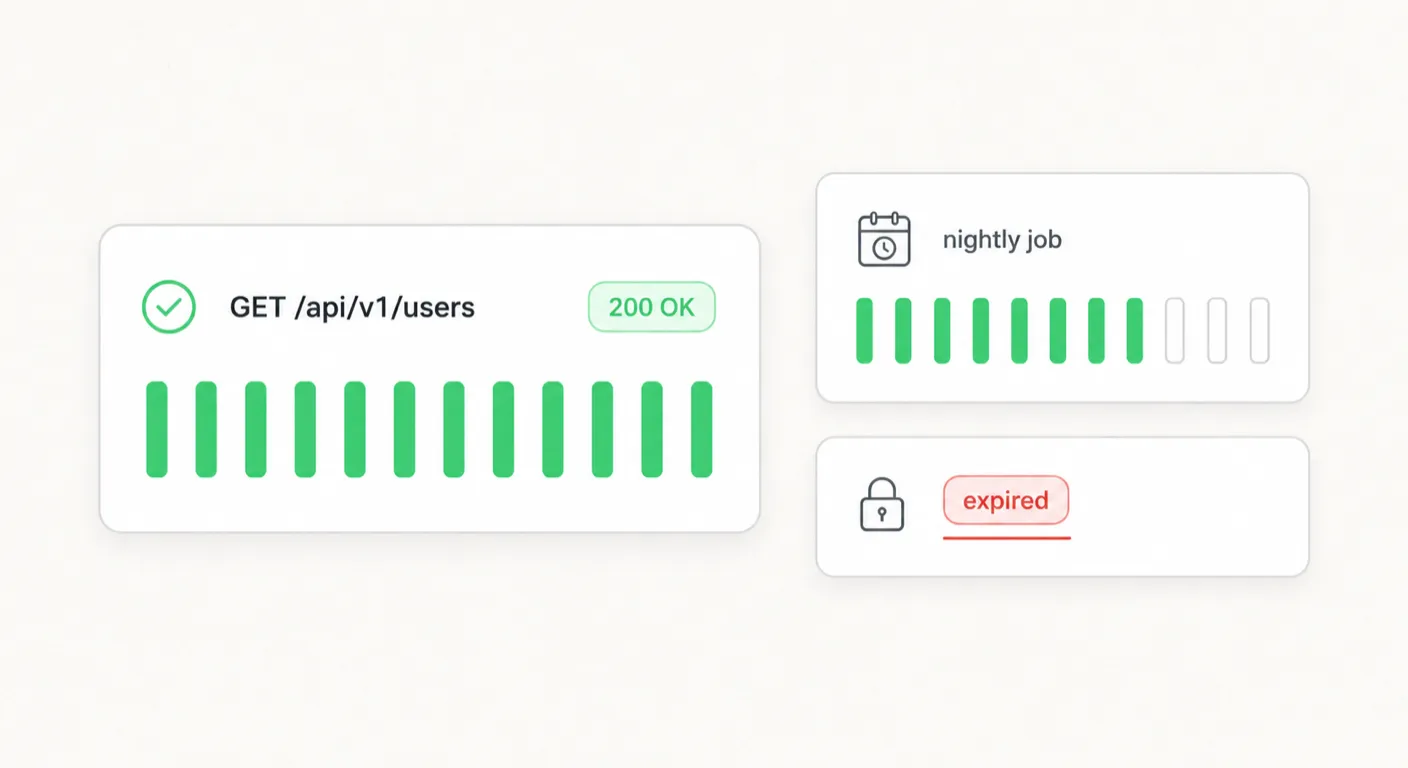
The API failures that cost the most are the ones nothing reports
When Microsoft Teams went dark on the morning of February 3, 2020, nothing had crashed and no traffic spike hit the servers. An authentication certificate had expired, and Teams could not verify itself to clients. Microsoft’s own status account posted that day: “We’ve determined that an authentication certificate has expired causing, users to have issues using the service.” A plain check on the front door, the kind that asks only whether a host answers, would have stayed green the whole time. The API monitoring best practices worth adopting are the ones that catch exactly this: a response that arrives but is wrong, work that silently never ran, or an outage only some of your users can see.
The cost of that blind spot is not the headline enterprise figure. ITIC’s 2024 Hourly Cost of Downtime Report, an independent web survey that polled over 1,000 firms worldwide from November 2023 through mid-March 2024, reports that “the average cost of a single hour of downtime now exceeds $300,000 for over 90% of mid-size and large enterprises.” That number describes companies with their own SRE teams, not a five-person startup. The figure that fits a small team is ITIC’s own floor for a micro business: fewer than 25 employees and a single server, which ITIC estimates at about $100,000 an hour and calls an “extremely conservative” figure.
A micro business with fewer than 25 employees loses roughly $100,000 for every hour of downtime, and ITIC calls that its conservative floor.
Monitoring that only asks whether the endpoint answered cannot see three whole classes of failure: functional failures where the body is wrong, regional failures where one geography is down, and scheduled work that never ran. The rest of this post is about closing those gaps without buying an observability platform you will not maintain. This assumes the argument in our post on why a green homepage is not a healthy system and gets specific about the how.
Good API monitoring best practices rest on four distinctions
Before you configure anything, decide what class of failure each check is responsible for. Four distinctions decide what your monitoring can catch, and confusing them is why teams feel covered while sitting on a blind spot.
| Distinction | What it catches | What it is blind to |
|---|---|---|
| Synthetic checks vs real user monitoring | Synthetic hits the endpoint on a schedule from outside and catches outright failure even at 3am with no traffic | It cannot see what real users experience across browsers, devices, and networks the way RUM can |
| Heartbeat vs request-response | Heartbeat catches a scheduled job that failed to run at all, because the job reports in on success | A request-response check cannot see a job, because a job that never runs sends nothing to check |
| Gateway vs endpoint | A gateway or load-balancer check confirms the front door is reachable and routing | It can pass while the service behind it returns errors, so a green gateway proves nothing about the endpoint |
| Payload validation vs status code | Payload validation reads the body and confirms the values are correct | A status-code check sees 200 and stops, missing a well-formed but wrong response |
The pattern across all four: a positive signal at one layer says nothing about the layer beneath it. A reachable host does not mean a working endpoint, and a working endpoint does not mean a correct answer. Assign each check a layer and know what it does not cover.
A status code is the least informative signal you collect
A status code tells you the server chose to send that number. It does not tell you the response was correct, fast, or the same everywhere. The signals that carry real information are latency percentiles, availability defined as correct responses, error-rate distribution, and throughput as context.
Latency is the first thing a synthetic checker gives you directly, and the average is the wrong way to read it. Latency distributions are right-skewed: most requests are fast and a long tail is slow. Track p95 and p99 instead. As System Design Roadmap’s tail-latency write-up puts it, “At scale, ‘rare’ events happen constantly, 1% of a billion requests is still 10 million angry users,” and averaging that tail away hides the exact requests that generate support tickets. A p50 of 180ms next to a p99 of 3 seconds is a system with a real problem that the mean reports as healthy.
Availability is the second signal a synthetic check gives you directly, and the definition matters. Measure availability as the share of checks that returned a correct response, not the share that reached a live host. A host that answers every probe with a 500 is reachable and completely down. Counting reachability as uptime is how teams publish 99.9% while users cannot log in.
Error rates and throughput are different. A synthetic checker sees them only through the narrow keyhole of its own requests, so the real error-rate distribution and request volume have to come from your own instrumentation. That distinction is worth stating plainly, because a checker that runs from outside does not see your traffic. When you do have that data, treat a 4xx spike as your problem, not the client’s. A sudden jump in 400s or 401s usually means you shipped a breaking change to a contract or an auth flow, and blaming the caller wastes the hour you had to catch it. Throughput is context: a rising error count against falling traffic reads very differently from the same count during a launch.
A 200 response can still be the wrong response
Availability and correctness are different jobs. Availability asks whether the service answered. Correctness asks whether the answer was right. A checkout API that returns 200 with an empty cart is available and broken, and only a check that reads the body knows the difference.
Cover a real transaction by chaining calls, because most failures live between endpoints rather than inside one. A login that returns a token, a request that spends the token, and a read that confirms the write all have to work in sequence. Each step can return 200 alone while the sequence is broken, for example when a token is issued but rejected by the next service.
Validate the shape and the values of the body. Consider a pricing endpoint that returns this on a 200:
{
    "status": "ok",
    "balance_cents": 0,
    "currency": "USD",
    "items": []
}
The status code is 200 and the JSON parses. An assertion written against it would require items to be non-empty and balance_cents to be a positive integer for this account. When a downstream pricing service times out and the API falls back to a safe default, it returns exactly this well-formed, empty, wrong response. A status check passes. The assertion fails and pages you. That is the failure class a status check cannot reach.
Two practical traps come with this. Auth tokens embedded in monitoring scripts expire, and when they do the monitor reports a 401 that looks like an outage but is a stale credential in your own check. Refresh tokens as part of the chain rather than pasting a long-lived one. Dynamic values cause the opposite problem: if you assert on an exact timestamp or a generated order ID, the check flakes on every run. Assert on types, ranges, and structure instead of literal values, so the check fails only when the contract actually breaks.
Payload assertions of this kind are not something Uptimeprobe does. Its HTTP checks confirm the response arrives with valid TLS and the status you expect, but they do not evaluate JSON bodies in the UI. Body-level assertions belong in your own test suite or in a tool built for them, such as Checkly, whose multi-step API checks let you chain requests and assert on intermediate responses.
Your API is only up in the places you check from
A single-region check reports the health of one path to your service, and if that path sits inside the same cloud region as the service, it can stay green straight through a user-visible outage. The clearest recent example is the AWS disruption of October 19 and 20, 2025. In its own post-event summary, AWS wrote that “the root cause of this issue was a latent race condition in the DynamoDB DNS management system that resulted in an incorrect empty DNS record for the service’s regional endpoint (dynamodb.us-east-1.amazonaws.com) that the automation failed to repair.” The event was concentrated in the N. Virginia (us-east-1) region and ran from 11:48 PM PDT on October 19 to 2:20 PM PDT on October 20. A check running from inside us-east-1 shared the broken resolution path. A check from Frankfurt or Sydney would have caught it immediately.
The self-contained rule: your API is only proven up from the locations you actually check from, so place checks where your users are, not where your servers are.
DNS and CDN behavior make this worse, because resolution and cache state differ by resolver and by point of presence. A record that resolves correctly from your office can return stale or empty from a resolver two continents away, and only a check on that continent sees it. Regional routing failures behave the same way: one edge node misbehaves while the rest of the network is fine. The Fastly outage of June 8, 2021 is the reference case for edge-level fragility. Fastly reported it “detected the disruption within one minute” and that “within 49 minutes, 95% of our network was operating as normal,” but during that window a valid customer configuration change triggered a latent bug that took down a large share of the network at once.
| Check location | What it catches that others miss | What it costs in noise |
|---|---|---|
| Same region as origin | Fast confirmation the service itself is running | Blind to any regional or DNS failure on the user’s path |
| A second continent | Regional outages, DNS and CDN divergence, routing failures | Occasional transient network blips between regions |
| A third region near real users | The experience of a user base you actually serve | Marginal, once two regions are already watched |
How many locations is enough is set by where your users are. Two regions catch nearly every regional and DNS failure that one misses. A third earns its place when you have a real user base in a third geography. Beyond that you are mostly paying for duplicate alerts. Uptimeprobe runs checks from Seattle, Nuremberg, and Sydney, each check runs from one location, and watching one endpoint from all three is three checks billed separately. That maps cleanly onto the two-to-three-region rule.
Cron jobs fail without telling anyone
A scheduled job that dies has a failure shape unlike everything else you monitor: there is no request, so there is no response, so there is nothing for a check to hit, so no alert fires. The job simply stops, and the first sign is a customer asking where last night’s report went.
Cron’s built-in notification is weaker than most people assume. Cron emails the job’s output only when the job writes to stdout or stderr, and it sends that mail to the crontab owner or to the address in the MAILTO variable. In a container there is usually no mail transfer agent installed and no local mail spool, so the message is generated and then goes nowhere. The alert you were relying on is discarded inside the container before anyone could read it.
GitLab’s database incident of January 31, 2017 is the canonical example, and their public postmortem is blunt about it. The nightly pg_dump backup was failing because it ran the wrong PostgreSQL version, and it failed silently. As GitLab wrote, “notifications were sent upon failure, but because of the Emails being rejected there was no indication of failure.” The failure emails were rejected for not being DMARC-signed. When an engineer later needed a restore, they found the backups had been empty and lost production data from a six-hour-plus window, which GitLab estimated “affected roughly 5,000 projects, 5,000 comments and 700 new user accounts.”
The fix is the heartbeat pattern, and its alert condition is inverted from every other check. The job pings a URL when it finishes successfully, and the monitor alerts on the absence of that ping within the expected window. No news is bad news. Instrument the jobs whose silent failure costs the most first: database backups, billing and invoicing runs, and data syncs between systems.
The one hard part is tuning the window. Too tight and a job that normally finishes in four minutes pages you the one Tuesday it takes six. Too loose and a job that has been dead for hours looks fine. Set the window from the job’s real worst-case runtime with headroom, and widen it after a false page rather than guessing low.
Uptimeprobe does not do heartbeat or cron monitoring. It has no ping endpoint for a job to call and no “did not check in” alert. For this job, reach for a tool built for it. Healthchecks.io is the specialist, is open source and self-hostable, and monitors 20 jobs on its free Hobbyist plan. Cronitor and Better Stack both include heartbeat monitoring, and Better Stack bundles 10 heartbeats into its free tier alongside 10 uptime monitors. Use one of those for scheduled work and do not try to force an HTTP checker into a shape it does not have.
Certificate expiry is an outage with a date on it
Most outages arrive unannounced. A few tell you the exact day they will happen, and you own the calendar. Certificates, domain registrations, and credentials all expire on a schedule you can see coming.
The TLS certificate is the scheduled outage you already own
A TLS certificate has an expiry date, and when it passes, clients refuse the connection even though the server is running perfectly. The Teams outage that opened this post was one form of it. The Ericsson case of December 6, 2018 was another and larger: an expired certificate in SGSN-MME software cut off around 32 million subscribers in the UK through O2 and caused a nationwide outage for tens of millions of SoftBank customers in Japan on the same day, across software that Ericsson said was deployed in 11 countries. Watch the expiry directly and alert weeks out, not hours. We cover the chain, SANs, and how to read a certificate in our guide to checking an SSL certificate, and Uptimeprobe has a free public checker at the SSL certificate tool that needs no account.
Domain-registration expiry is a separate failure from certificate expiry, and it recovers far more slowly. A lapsed certificate is fixed by installing a new one in minutes. A lapsed domain can enter a redemption or pending-delete status where you cannot simply renew it, and getting it back can take days or cost a redemption fee. Uptimeprobe checks domain-registration expiry over RDAP, the structured protocol that replaced WHOIS, which is a genuinely different check from reading the TLS certificate on the endpoint.
Watch for calls from unexpected places and retired credentials
The security signal that shows up in monitoring is authentication behaving oddly: a spike in 401s, calls arriving from a region you do not serve, or a credential you retired still being used. None of these is a status-code failure, and all of them are worth an alert. API security best practices treat a retired key that keeps getting used as an incident, not a curiosity.
Traffic shape moves before logs do
An unusual volume of requests, a sudden change in the ratio of one endpoint to another, or a flat line where there should be a daily rhythm often appears in monitoring before it surfaces in logs you have to go read. You will not get request volume from an external checker, but where you have your own instrumentation, a shift in traffic shape is an early warning worth wiring to an alert.
Every tool you add is another place an alert gets missed
Consolidation versus best-of-breed is a real trade-off, and the honest cost of fragmentation is not the monthly bill. It is the alert that fired into a Slack channel nobody reads, from a tool one engineer set up and then left. Every additional monitoring tool is another inbox, another webhook, and another place a page can land unseen.
The deciding question is where your on-call attention already lives. Route alerts there. If the team works incidents in PagerDuty, monitoring that cannot reach PagerDuty is monitoring that will be missed during the incident it was bought to catch. Uptimeprobe delivers alerts to HTTPS webhook destinations, signed with a per-destination secret, with retries and a delivery log, and does not ship native Slack, PagerDuty, Discord, email, or SMS integrations. Getting an alert into Slack or PagerDuty therefore means pointing the webhook at a relay, which is a normal pattern but is work you should know about before you choose it.
Checks in version control versus a web form is the other recurring choice. Config in Git gives you review, history, and reproducibility, and it costs you a setup step and a small learning curve, which is the model Checkly is built around. A web form is faster to start and easier for a non-specialist to change, at the cost of an audit trail. Neither is wrong. Pick the one your team will keep current, because a check nobody edits drifts out of date either way.
Keep monitoring overhead proportionate to team size. A five-person team that spends a day a week tending dashboards has bought itself a second job. The right amount of monitoring is the amount someone will actually maintain.
Most monitoring setups fail in the same four ways
Four anti-patterns account for most of the monitoring setups that quietly stop working. Each has a fix you can apply this afternoon.
- Alerting on everything until the channel gets muted. When every blip pages, people filter the channel, and the one real page arrives to a muted room. Fix it by splitting alerts into two tiers today: page-worthy signals that mean a human should act now, and ticket-worthy signals that can wait for business hours. Only the first tier is allowed to wake anyone.
- Dismissing 4xx as the client’s problem. A steady background of 404s is normal. A sudden spike in 400s or 401s usually means you shipped a breaking change to a contract or an auth flow. Fix it by alerting on a rate-of-change in 4xx, not an absolute floor, so a deploy that breaks callers pages you instead of them.
- Not watching third-party dependencies. You cannot fix a payment provider or an upstream API, but you can attribute an incident to it in minutes instead of hours. Fix it by adding an external check against each critical third party, so when your errors spike you can immediately say whose fault it is.
- Publishing an SLA with no measurement behind it. A “99.9% uptime” promise with nothing recording actual uptime is a number you made up. Fix it by pointing a synthetic check at the endpoint the SLA covers and letting its history be the measurement, so the figure you publish is one you can defend.
Pick the tool you will still be maintaining in six months
The real choice is not which tool sees the most. It is which tool your team will still have configured correctly in six months. Full APM suites see more and cost more in both money and setup than a small team recovers. Lightweight checkers see less and tend to get configured once and stay configured. For a team without a dedicated SRE, the second usually wins on total value.
Decide on three factors: your team size, whether anyone owns monitoring as an actual job, and whether you need distributed traces or just need to know when something breaks. If nobody owns it, buy less tool. The prices below were checked on each vendor’s pricing or docs pages in July 2026.
| Tool | Entry price | Free tier | Heartbeat / cron monitoring |
|---|---|---|---|
| Healthchecks.io | $20/mo Business | Yes, 20 jobs | Yes, this is its specialty |
| Cronitor | Usage-based, $2 per monitor plus $5 per user | Yes, 5 monitors | Yes |
| Better Stack | Paid responder plans | Yes, 10 monitors and 10 heartbeats | Yes |
| UptimeRobot | $7 to $9/mo Solo | Yes, 50 monitors, personal use only | Yes, heartbeat monitors |
| Checkly | $24/mo Starter (annual) | Yes, Hobby tier | No, it is synthetic and multi-step |
| Pingdom | About $10 to $15/mo Synthetic | No | No |
| Datadog Synthetics | $5 per 10,000 API test runs | No | No, part of the wider Datadog platform |
Uptimeprobe belongs in this list as the small, honest option, and it is worth being clear about its edges. It offers three check types: HTTP, TCP connect to a host and port, and domain-registration expiry over RDAP. HTTP checks let you set the method, headers, body, redirect handling, TLS validation, and IPv4 or IPv6. It runs from Seattle, Nuremberg, and Sydney. Pricing is per check per month by frequency, from $1.20 at 30 seconds down to $0.05 daily, the first five checks are free, every feature is included with no plans or gates, and a card is required before the first check. What it does not do is as important: no heartbeat or cron monitoring, no multi-step chains, no JSON payload assertions in the UI, no APM or tracing or logs, and no native Slack or PagerDuty alerting. If you need traces and log aggregation, buy Datadog and pay for it. If you need to watch scheduled jobs, use Healthchecks.io. Uptimeprobe is for knowing, from outside and from more than one place, whether an endpoint is answering correctly.
TL;DR
- A 200 response only means the server sent that number. Availability should be measured as the share of checks that returned a correct response, not the share that reached a live host.
- Read latency at p95 and p99, never the average, because the tail is where the failures your users feel actually live.
- A scheduled job that dies sends nothing, so a request-response check can never catch it. Use a heartbeat that alerts on the absence of a success ping, and instrument backups and billing runs first.
- Check from at least two regions. The AWS us-east-1 event of October 2025 stayed invisible to any check sharing the region’s broken DNS path and obvious from another continent.
- Certificate and domain expiry are the outages with a date on them. Watch both directly and alert weeks ahead, because a lapsed domain can take days to recover.
Where to start this week
Do these three things in order.
- In the next ten minutes, run your production endpoint through the free SSL certificate checker and write the expiry date in your team calendar with an alert two weeks out. No account required.
- This week, put a heartbeat on your most important scheduled job, the backup or the billing run, using a tool built for it, and confirm the alert fires by letting the job miss one window on purpose.
- Before the sprint ends, add a synthetic check on your critical endpoint from two regions, and set it to assert on the response body, not just the status code.
If external, multi-region HTTP, TCP, and domain-expiry checks are what you need, Uptimeprobe runs the first five free with every feature included: see pricing or create an account.
Further reading: why a green homepage is not a healthy system and how to check an SSL certificate. For primary data, see the AWS post-event summary of the October 2025 DynamoDB disruption, ITIC’s 2024 Hourly Cost of Downtime Report, and GitLab’s 2017 database outage postmortem.